1. What you get
Lean Operations Monitor is an Excel add-in. Free tools stay free. Lean Ops Pro is optional.
OEE Calculator, Takt Time, and Pareto Analysis. Open them from the Lean Ops ribbon or Home.
Workbook setup, reference data, production and downtime logs, and analytics (OEE, losses, MTTR/MTBF, reports).
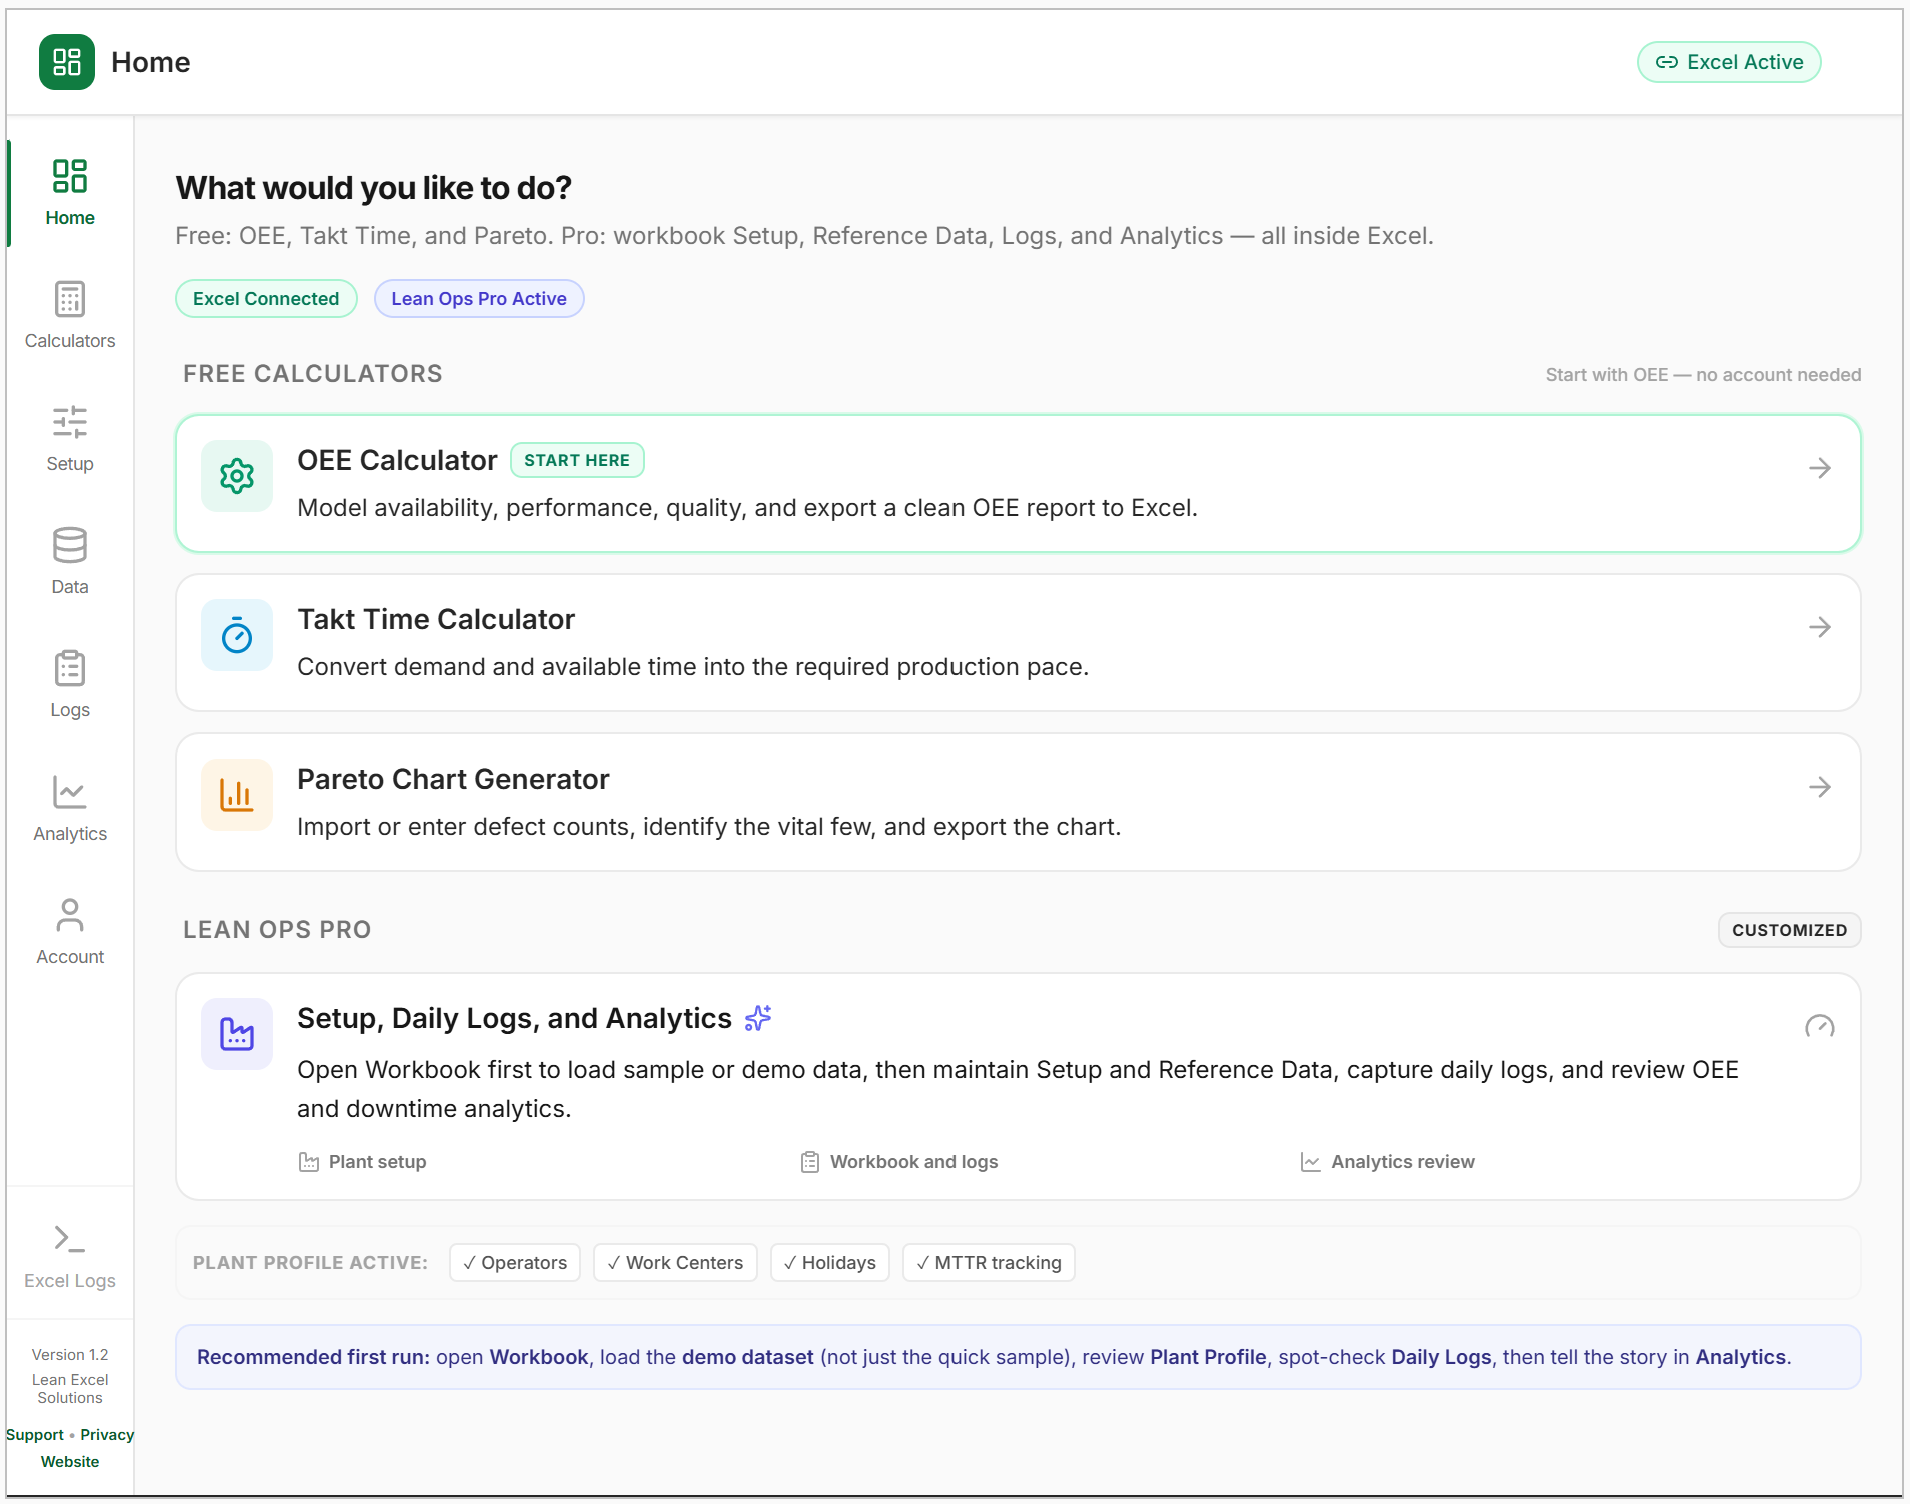
01-what-you-get.png in public/help/2. Open the add-in

02-open-add-in.png3. Free tools
No sign-in. Use these any time, including before you subscribe.
OEE Calculator
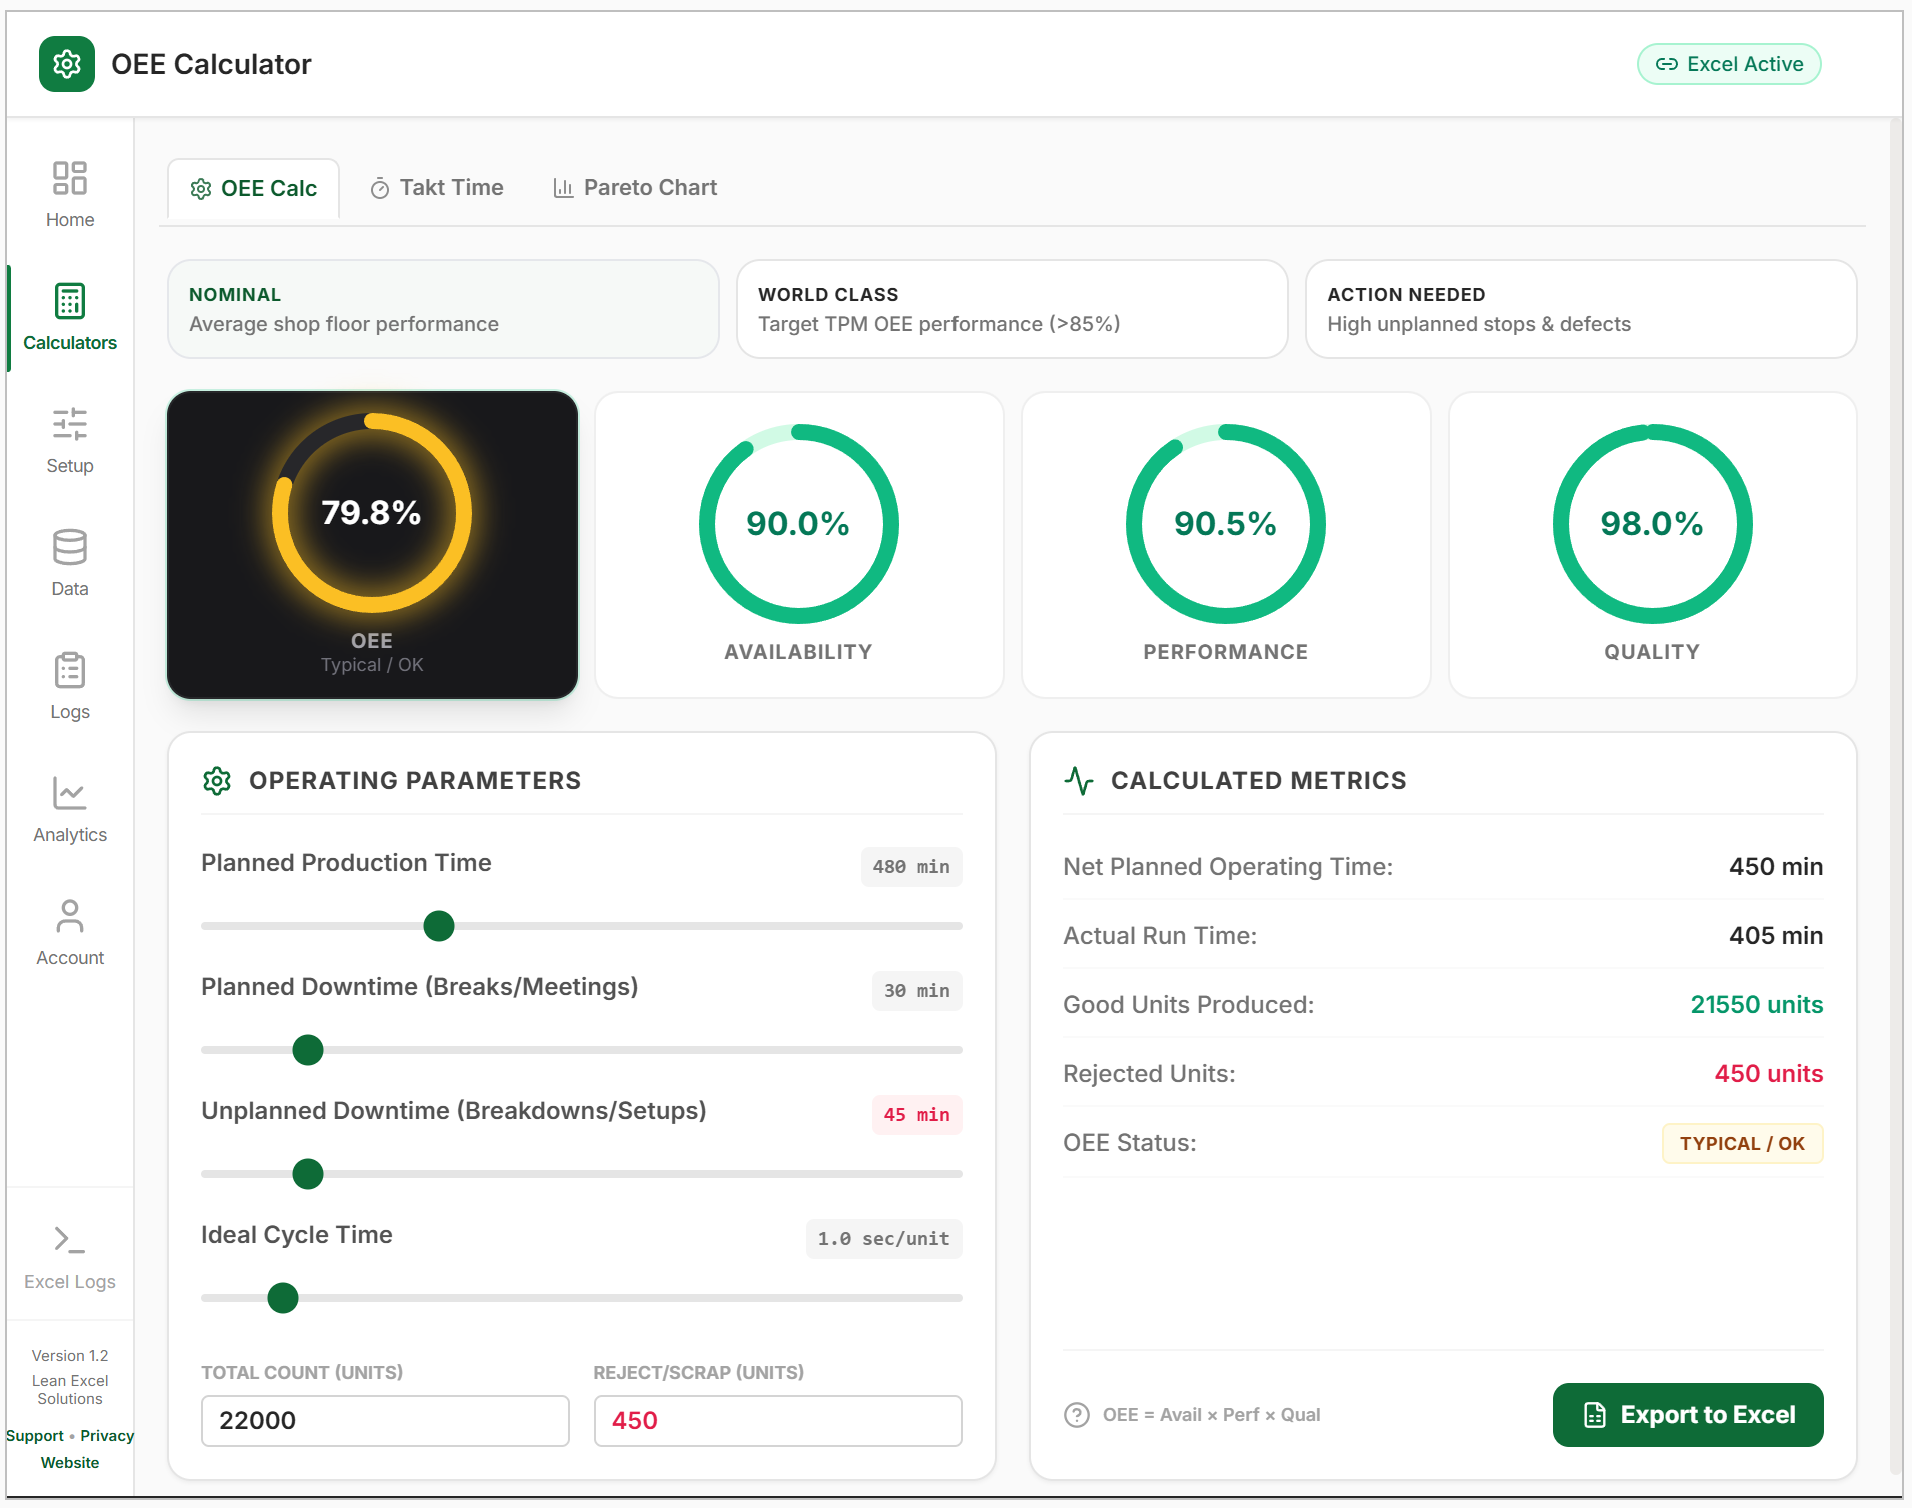
03-oee.pngTakt Time
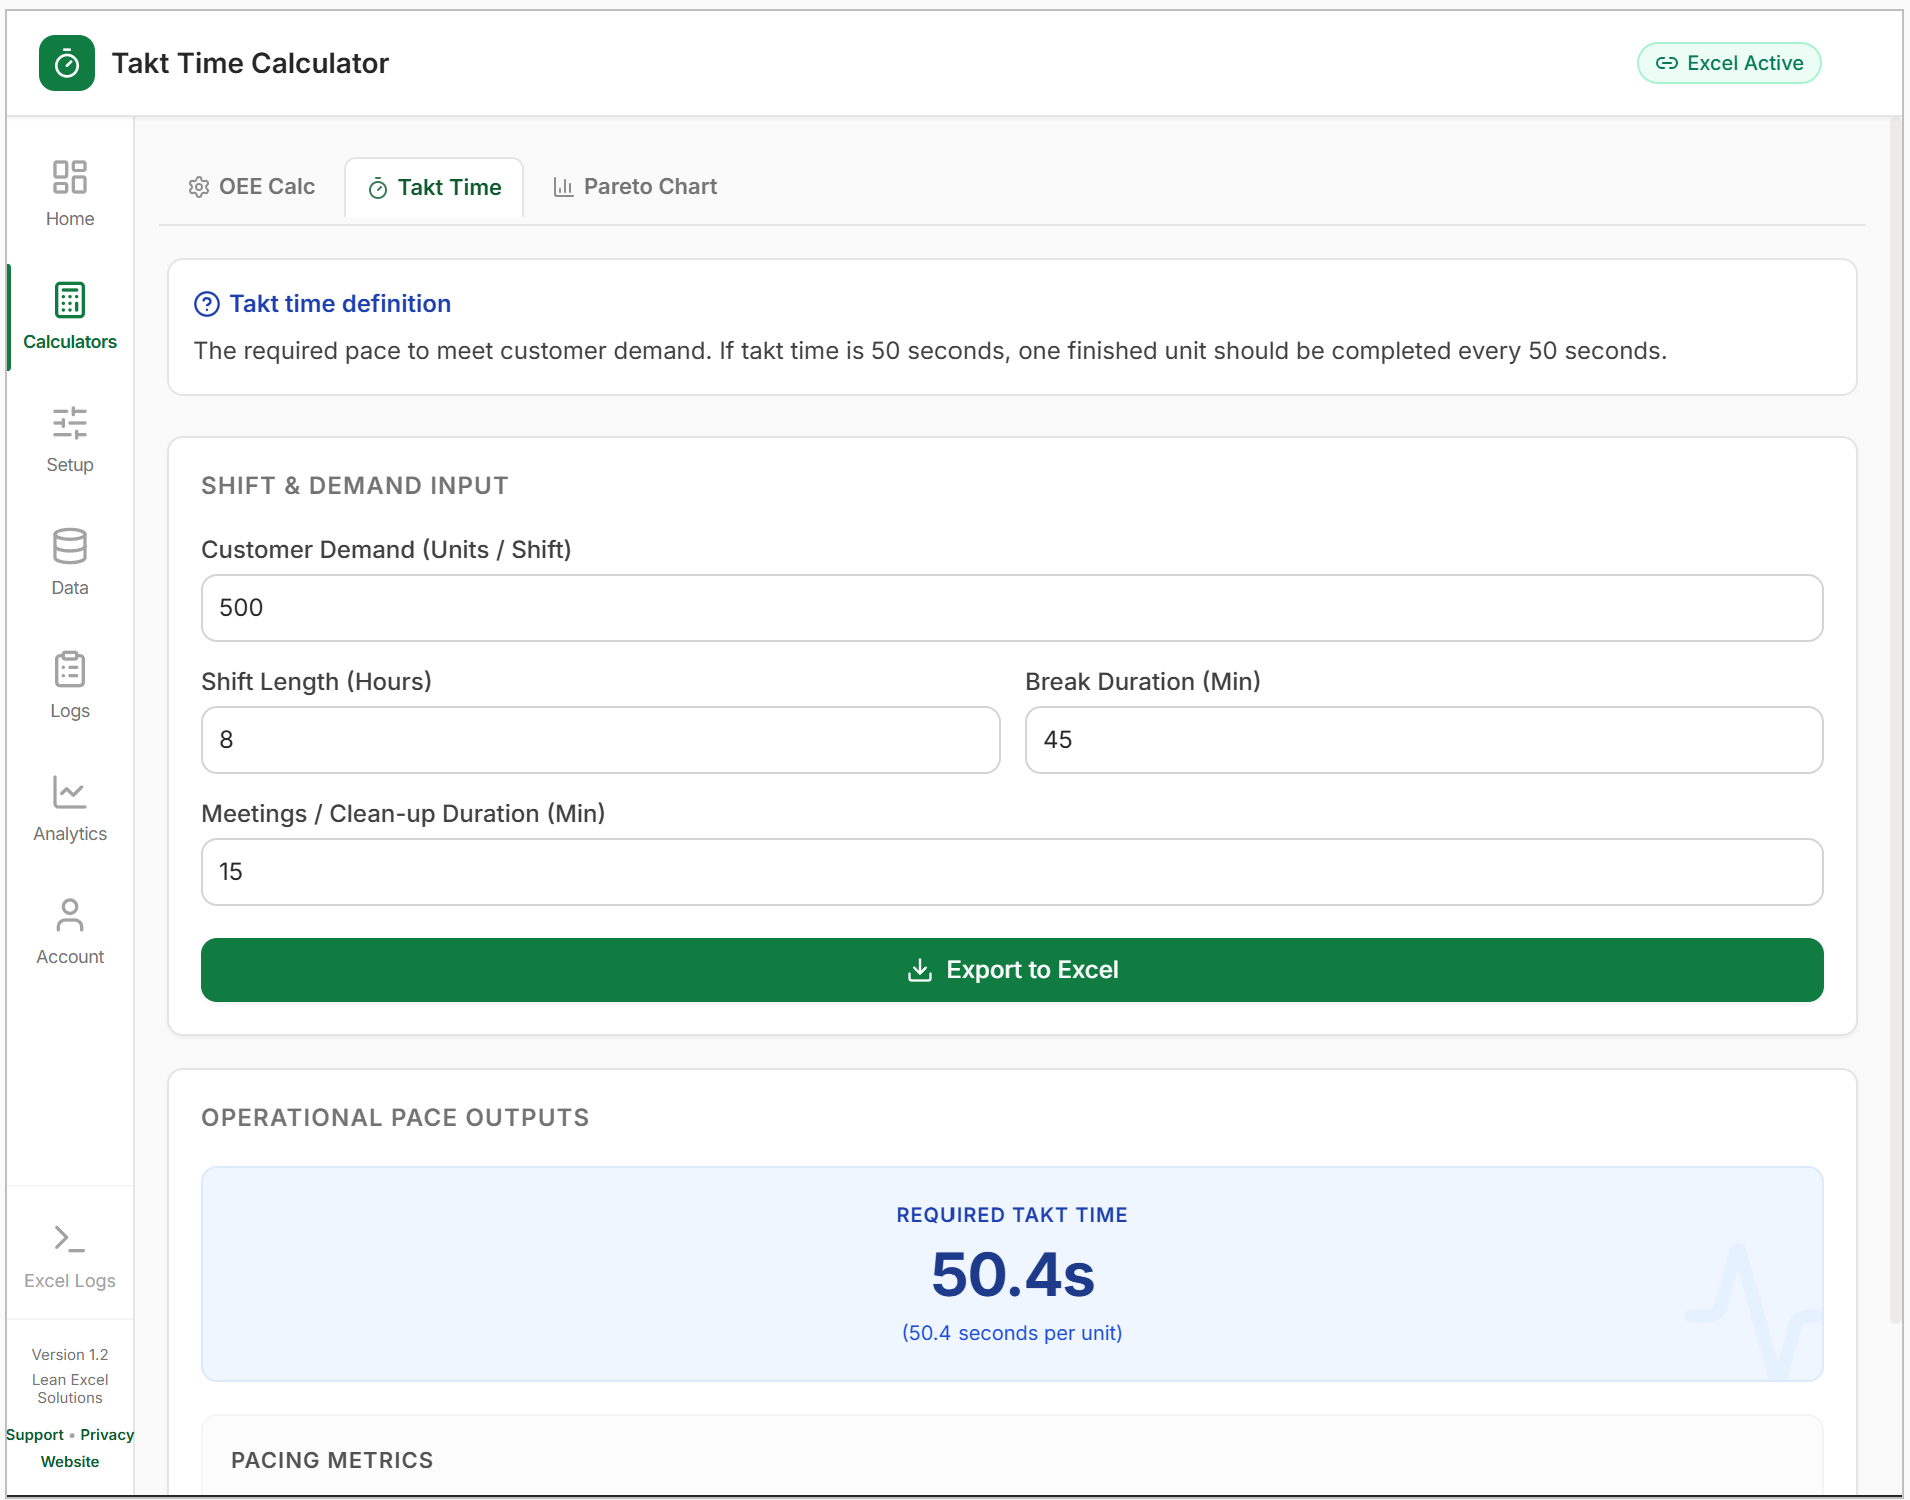
04-takt.pngPareto Analysis
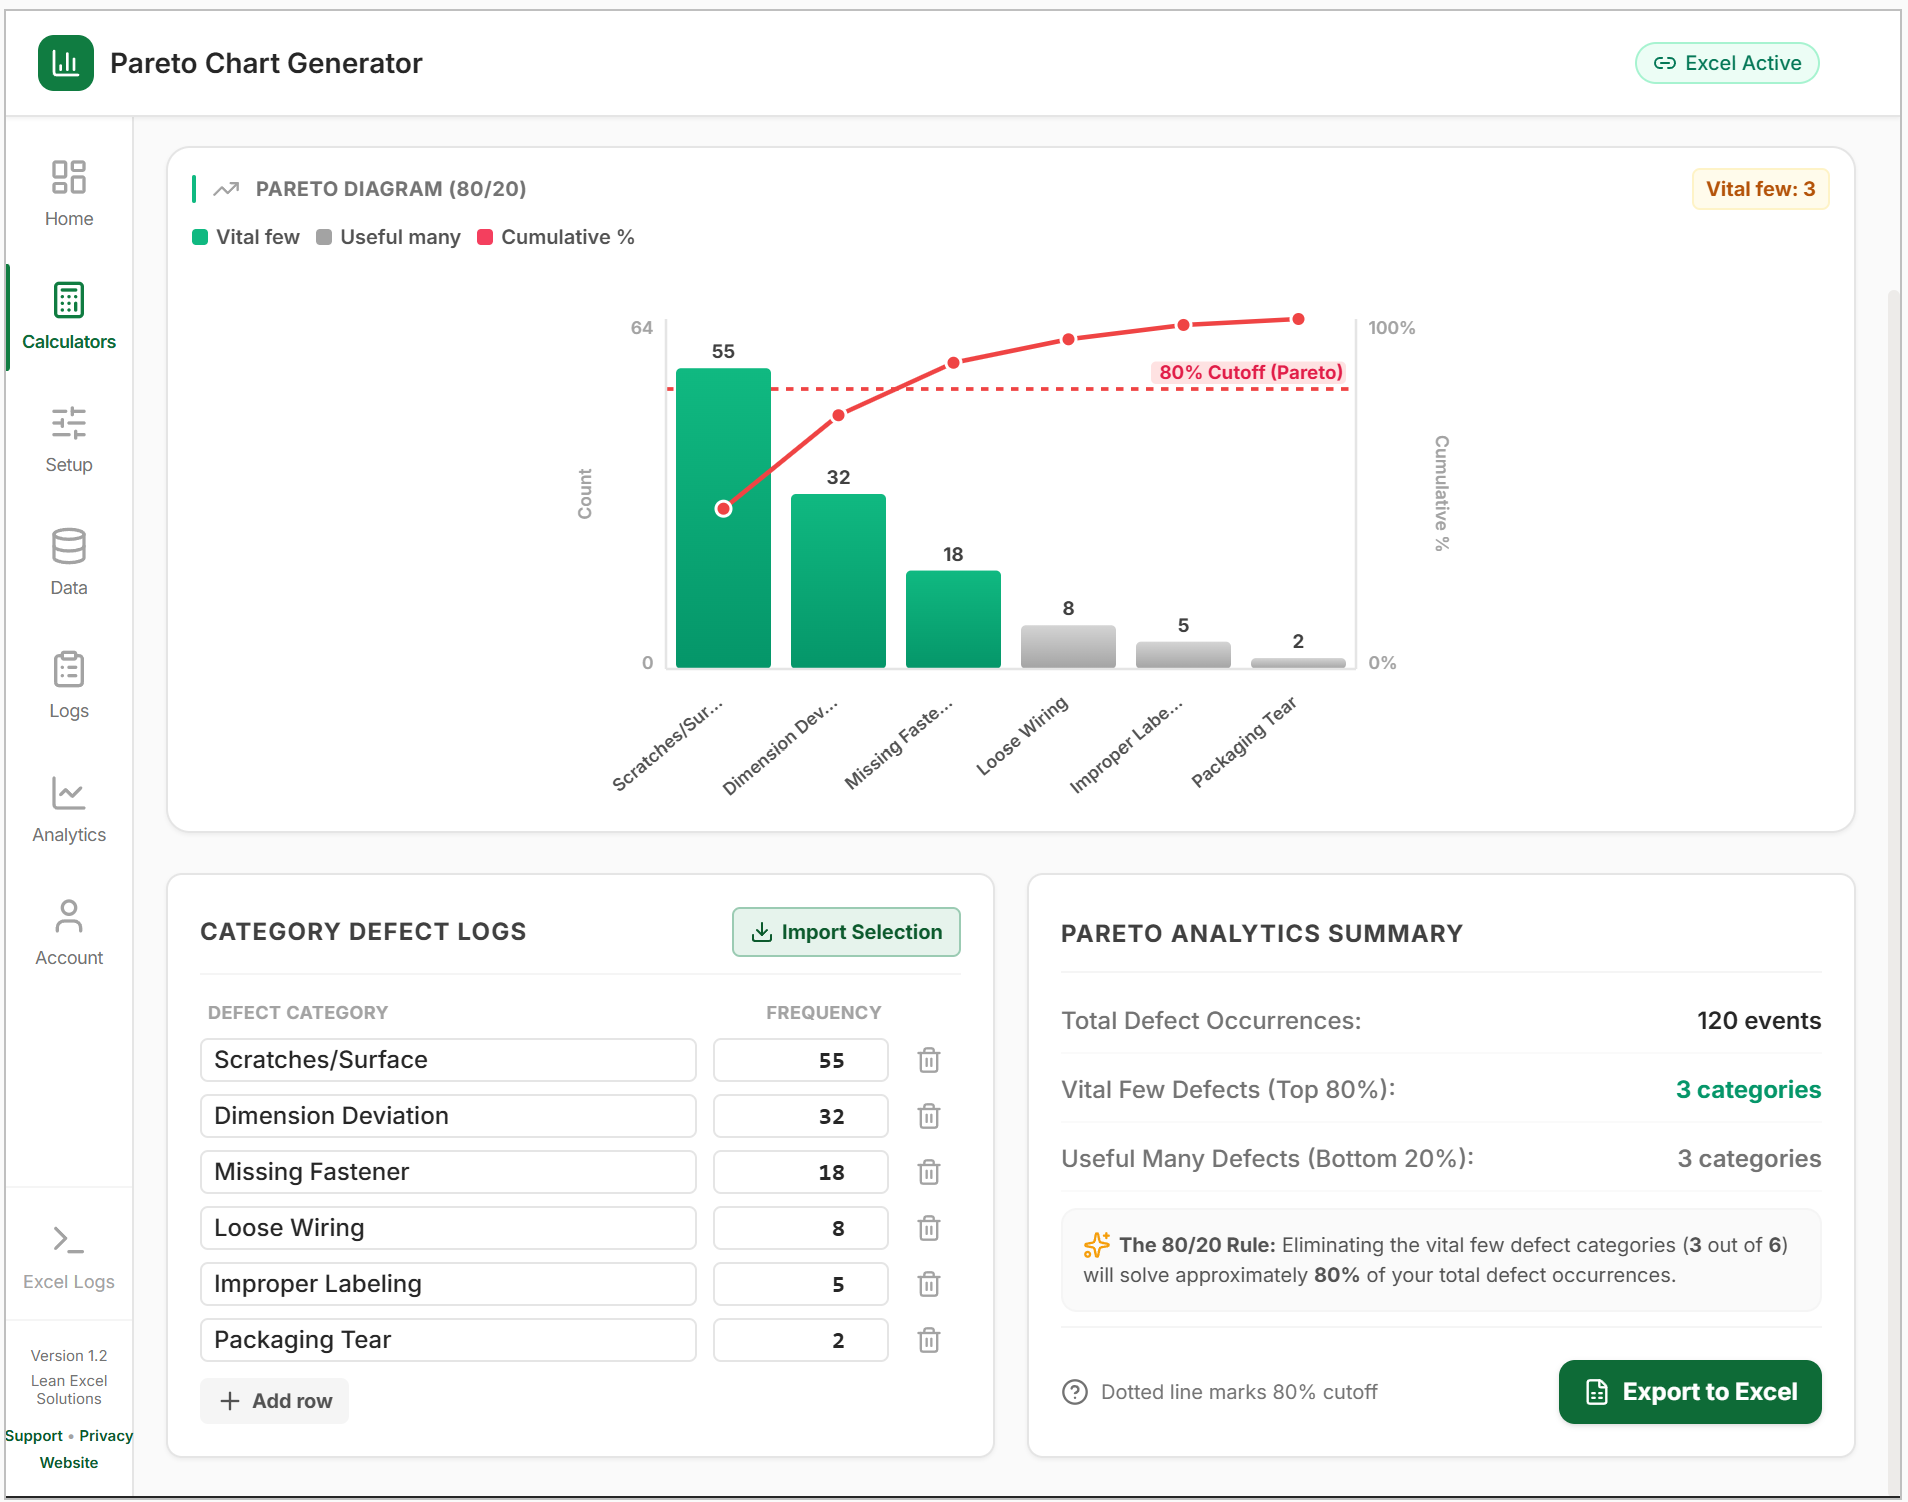
05-pareto.png4. Start Pro
Skip this section if you only need the free calculators.
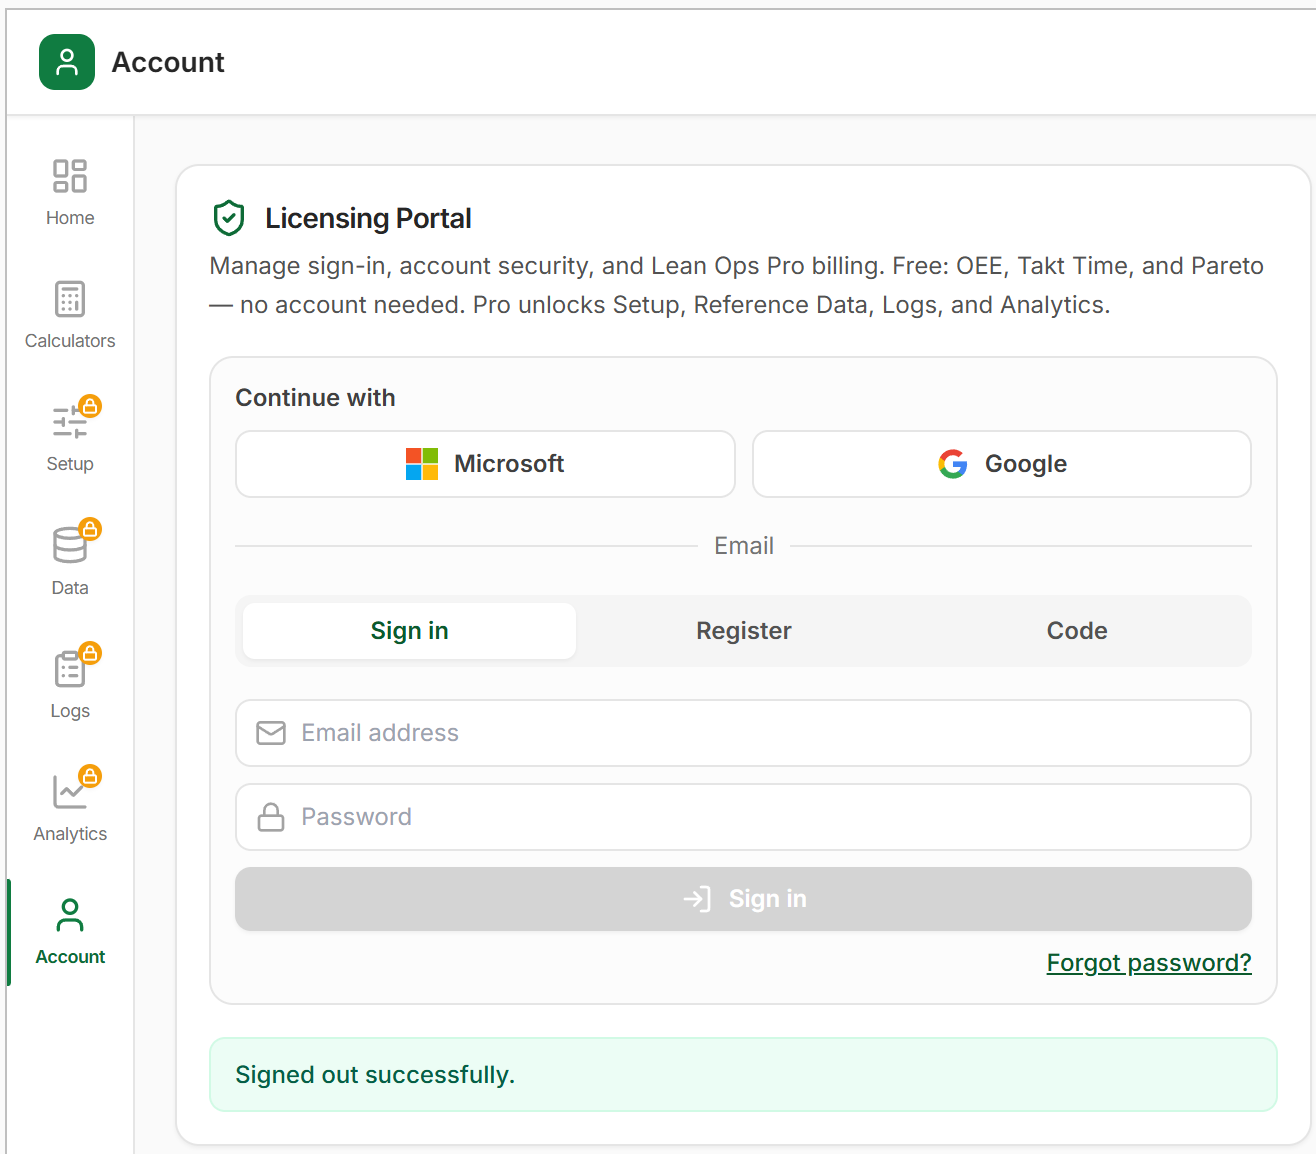
06-account.png5. First Pro run (demo)
Do this once before you put your own plant in the workbook. Use the demo dataset (~91 days), not the tiny sample tables.
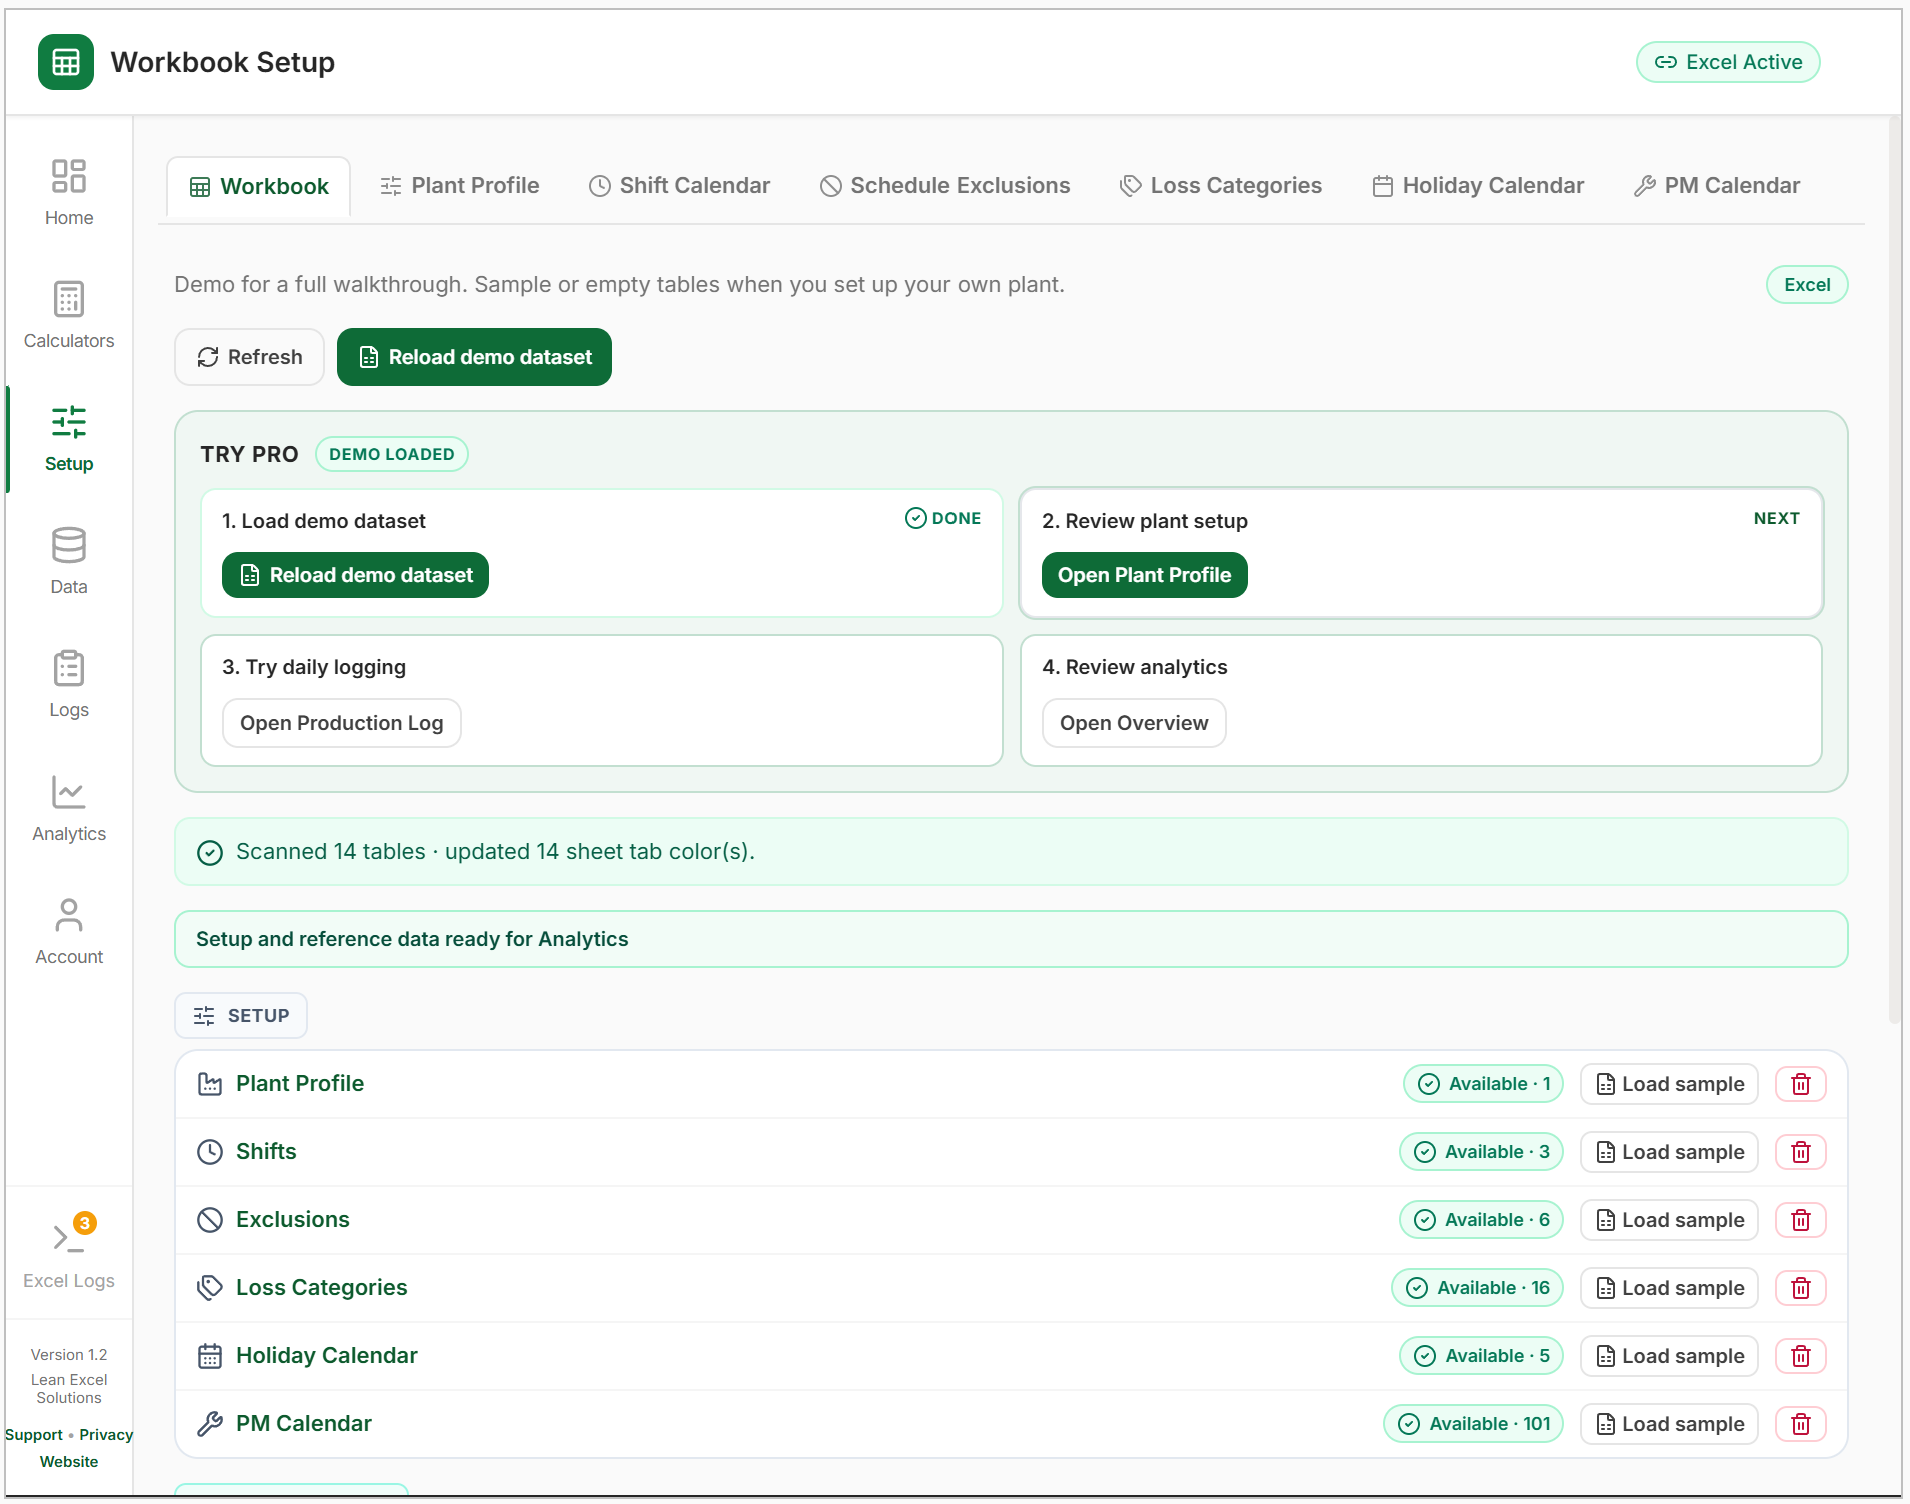
07-workbook-demo.png6. Set up your plant
When you are ready to leave the demo, start from an empty workbook (or a copy) so you do not overwrite live data by accident.
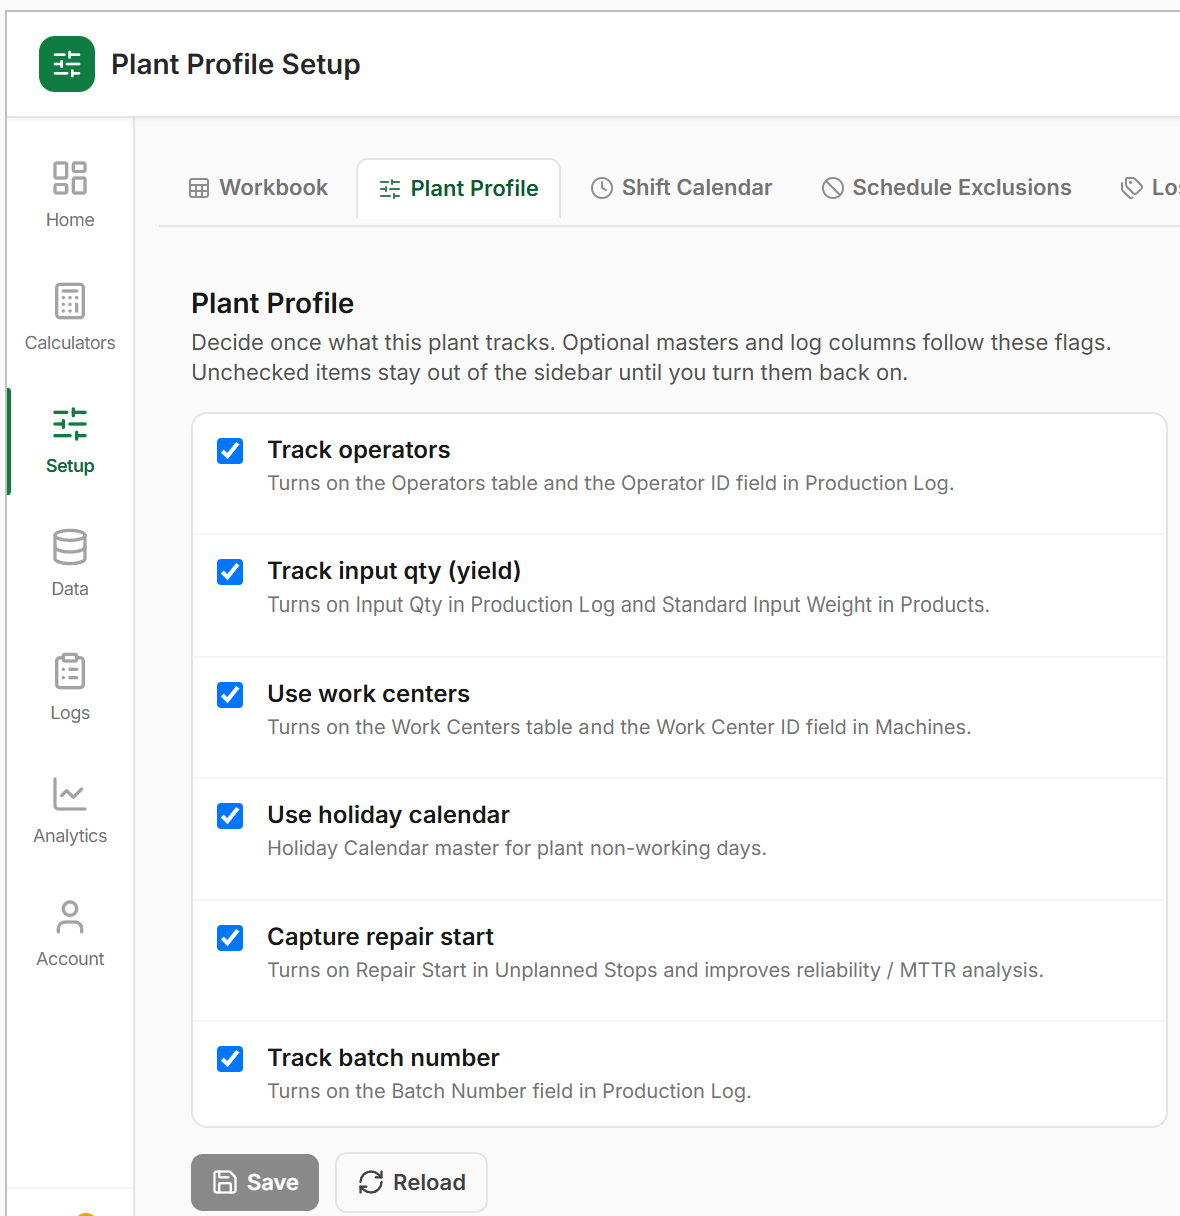
08-plant-profile.png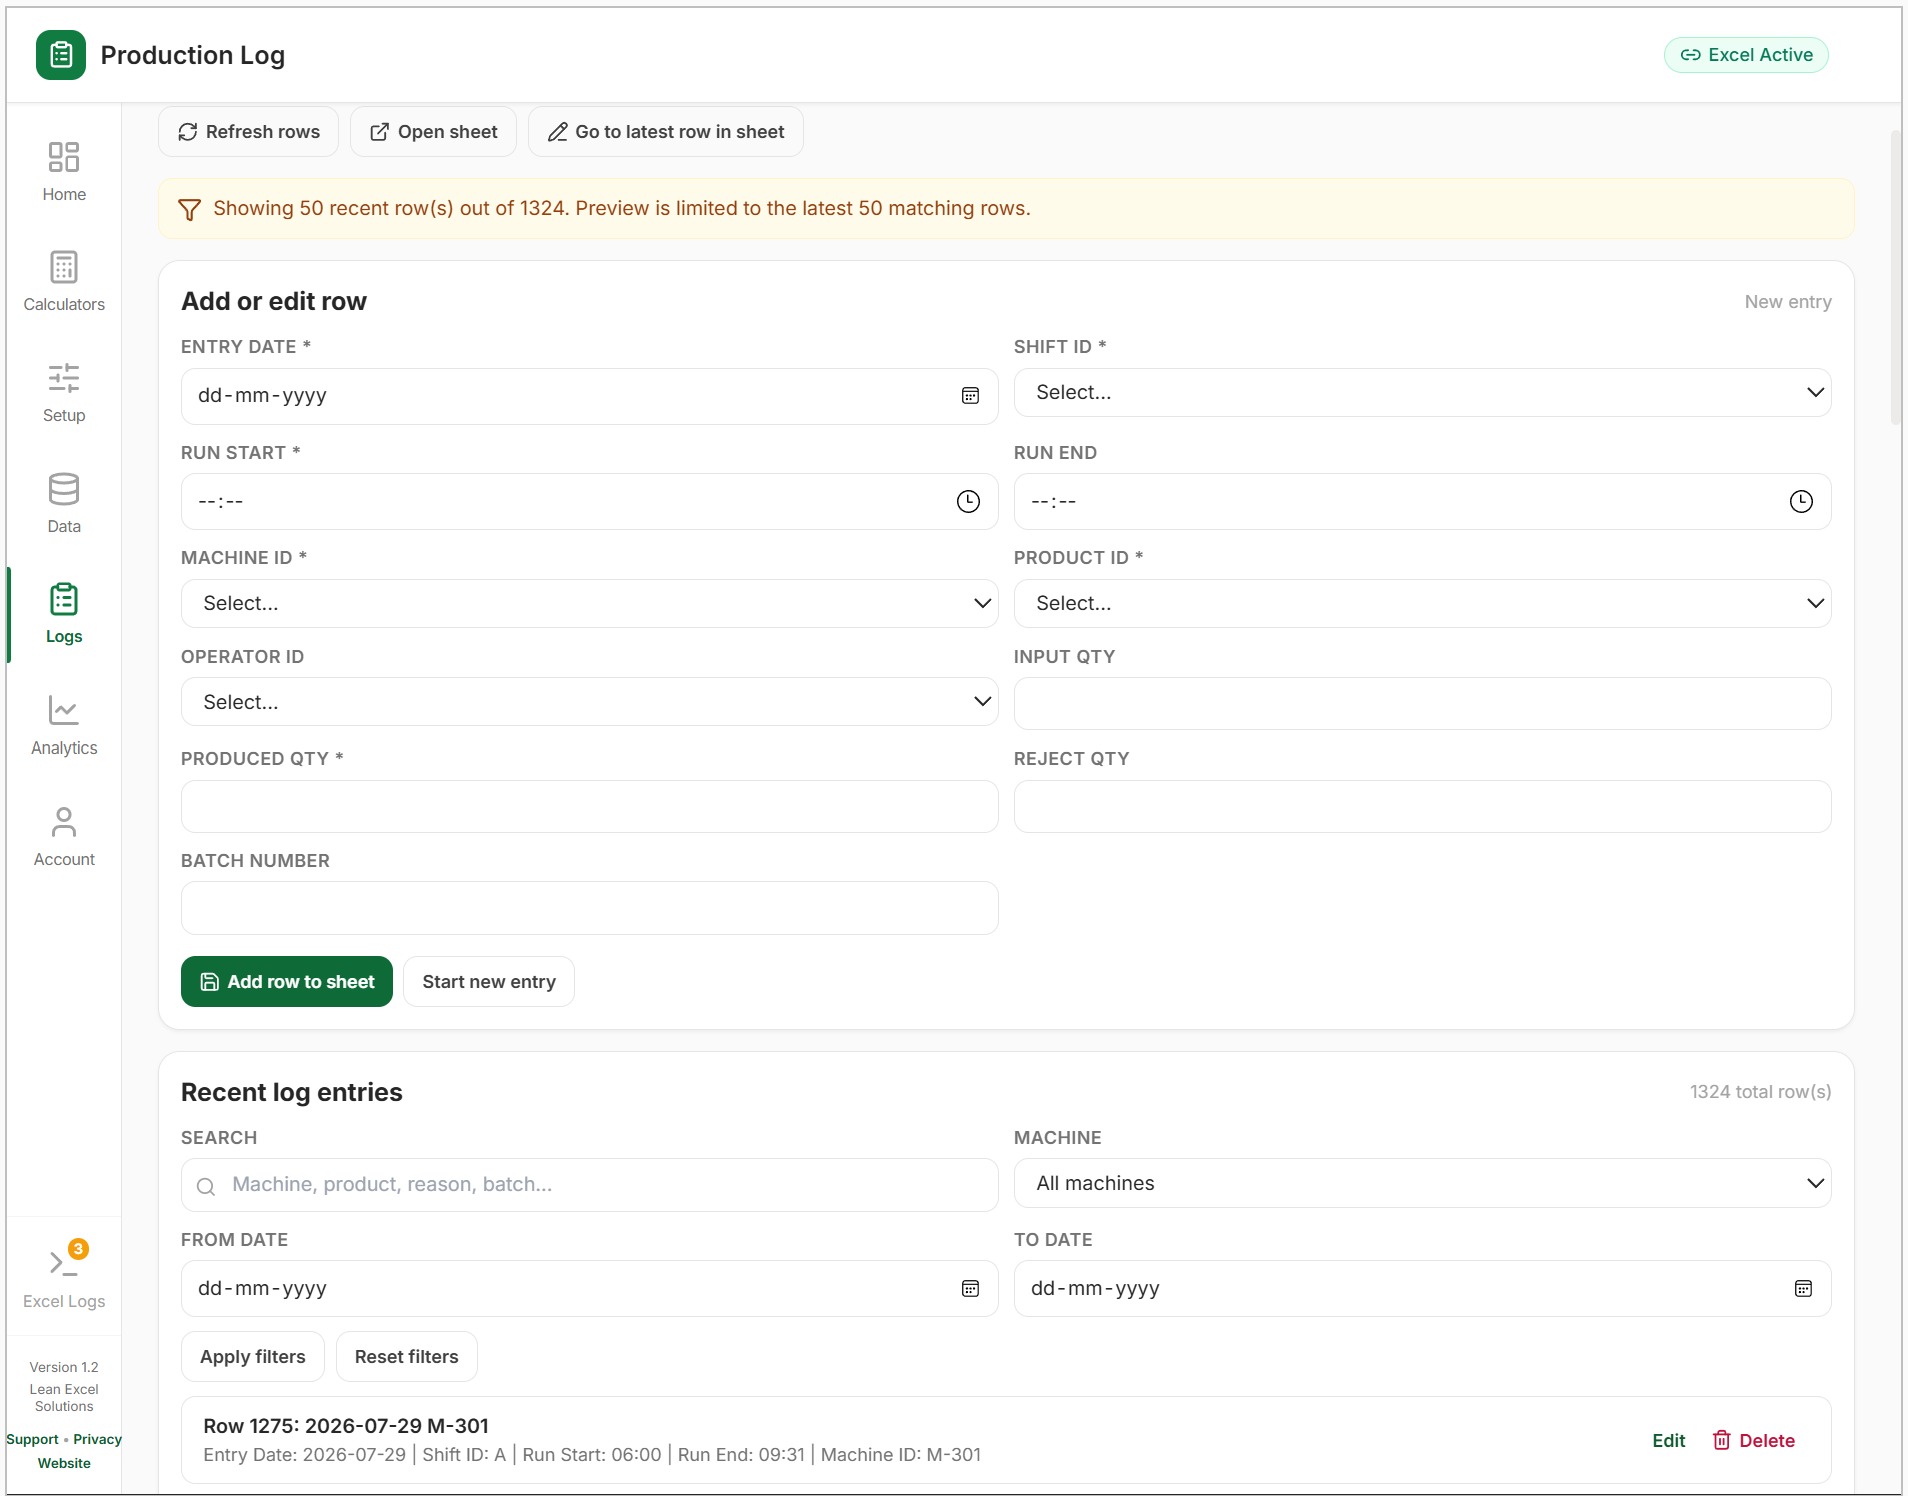
09-production-log.png7. Read the plant
Analytics reads the workbook. After you load data or edit logs, tap Refresh.
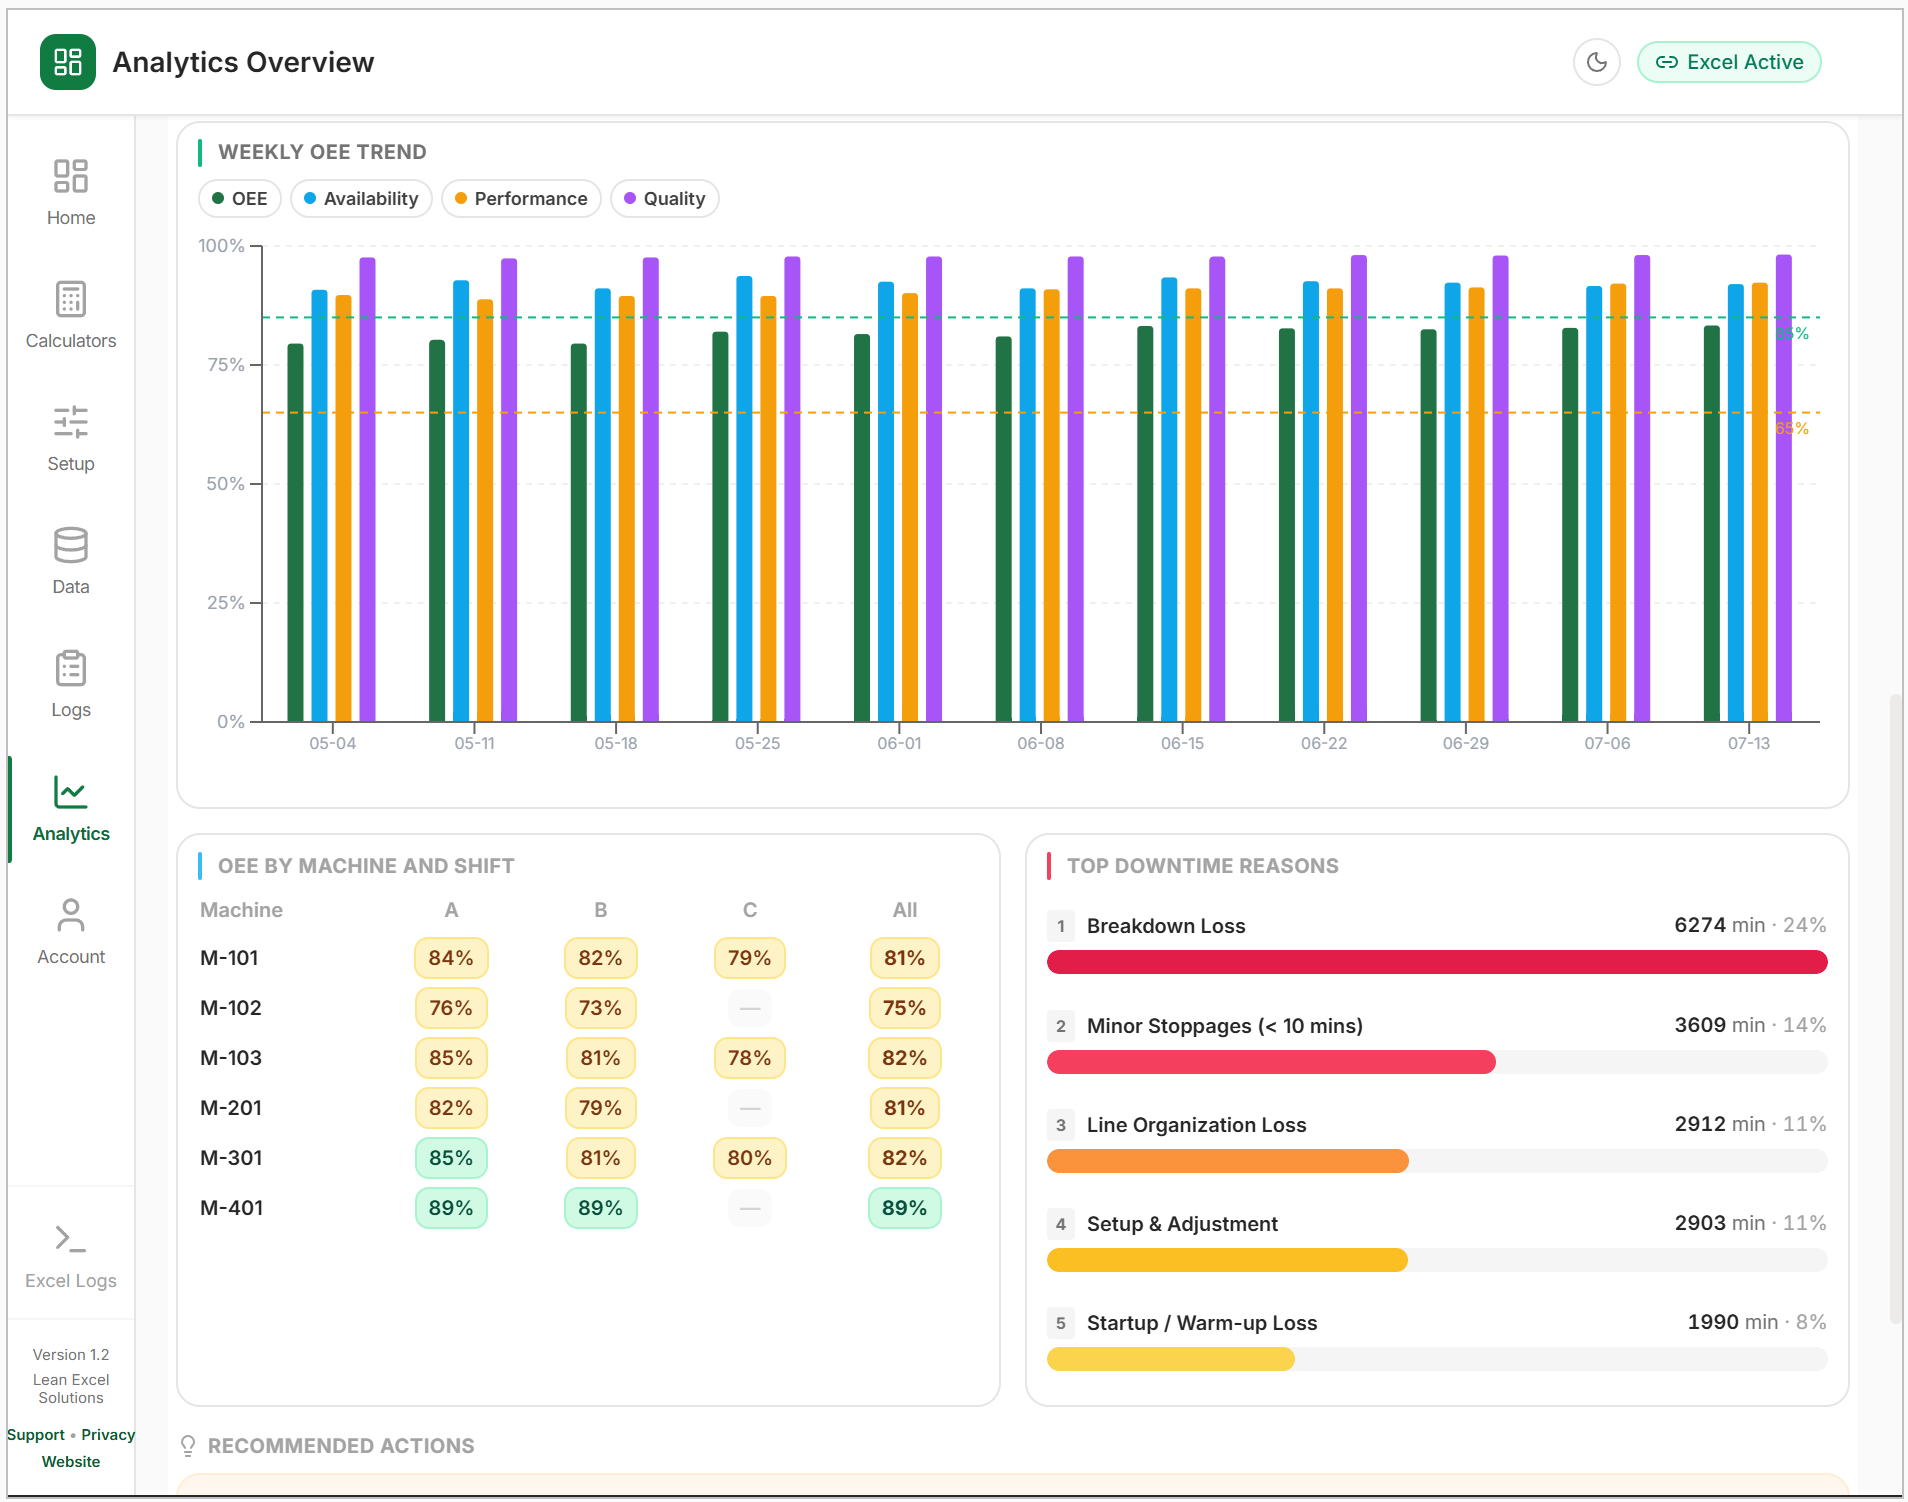
Where do we stand? OEE / A / P / Q gauges, weekly trend, machine × shift heatmap, and the top losses for the filter.
Where did time go? Waterfall of planned time, downtime mix, Pareto (click a bar to drill), frequency vs duration, MTTR / MTBF, PM adherence.
Six export tables (machine, shift, weekly, downtime reason, reliability, day × shift × machine). Preview in the pane; export to sheets you can mail.
Period, work center, machine, shift, product, and operator (when enabled). Every number is for the selected period only.
10-overview.png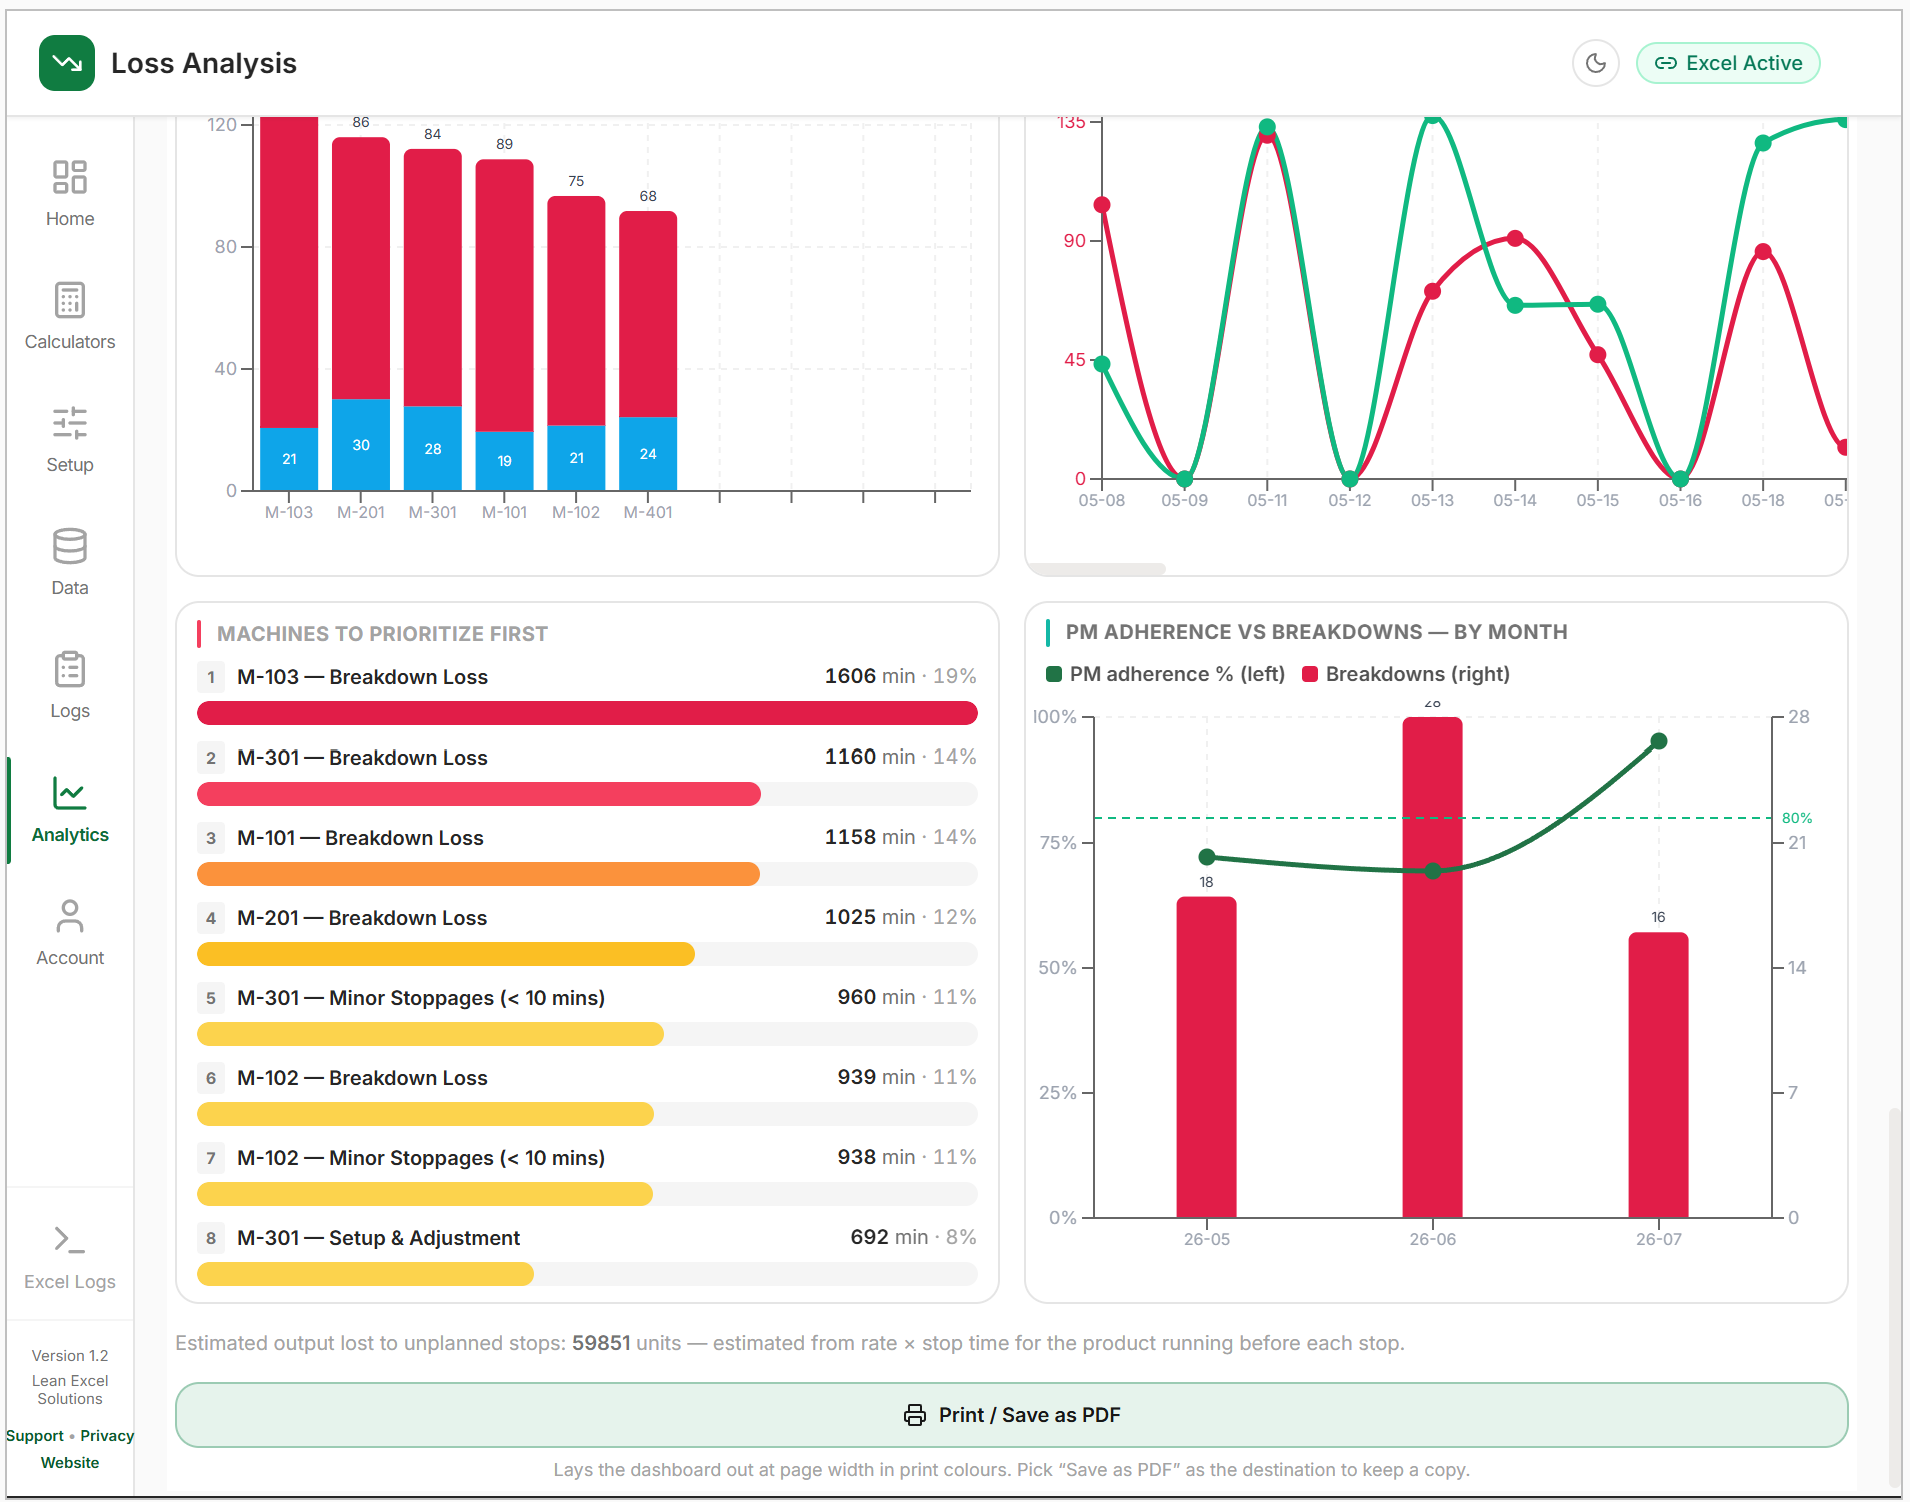
11-loss-analysis.png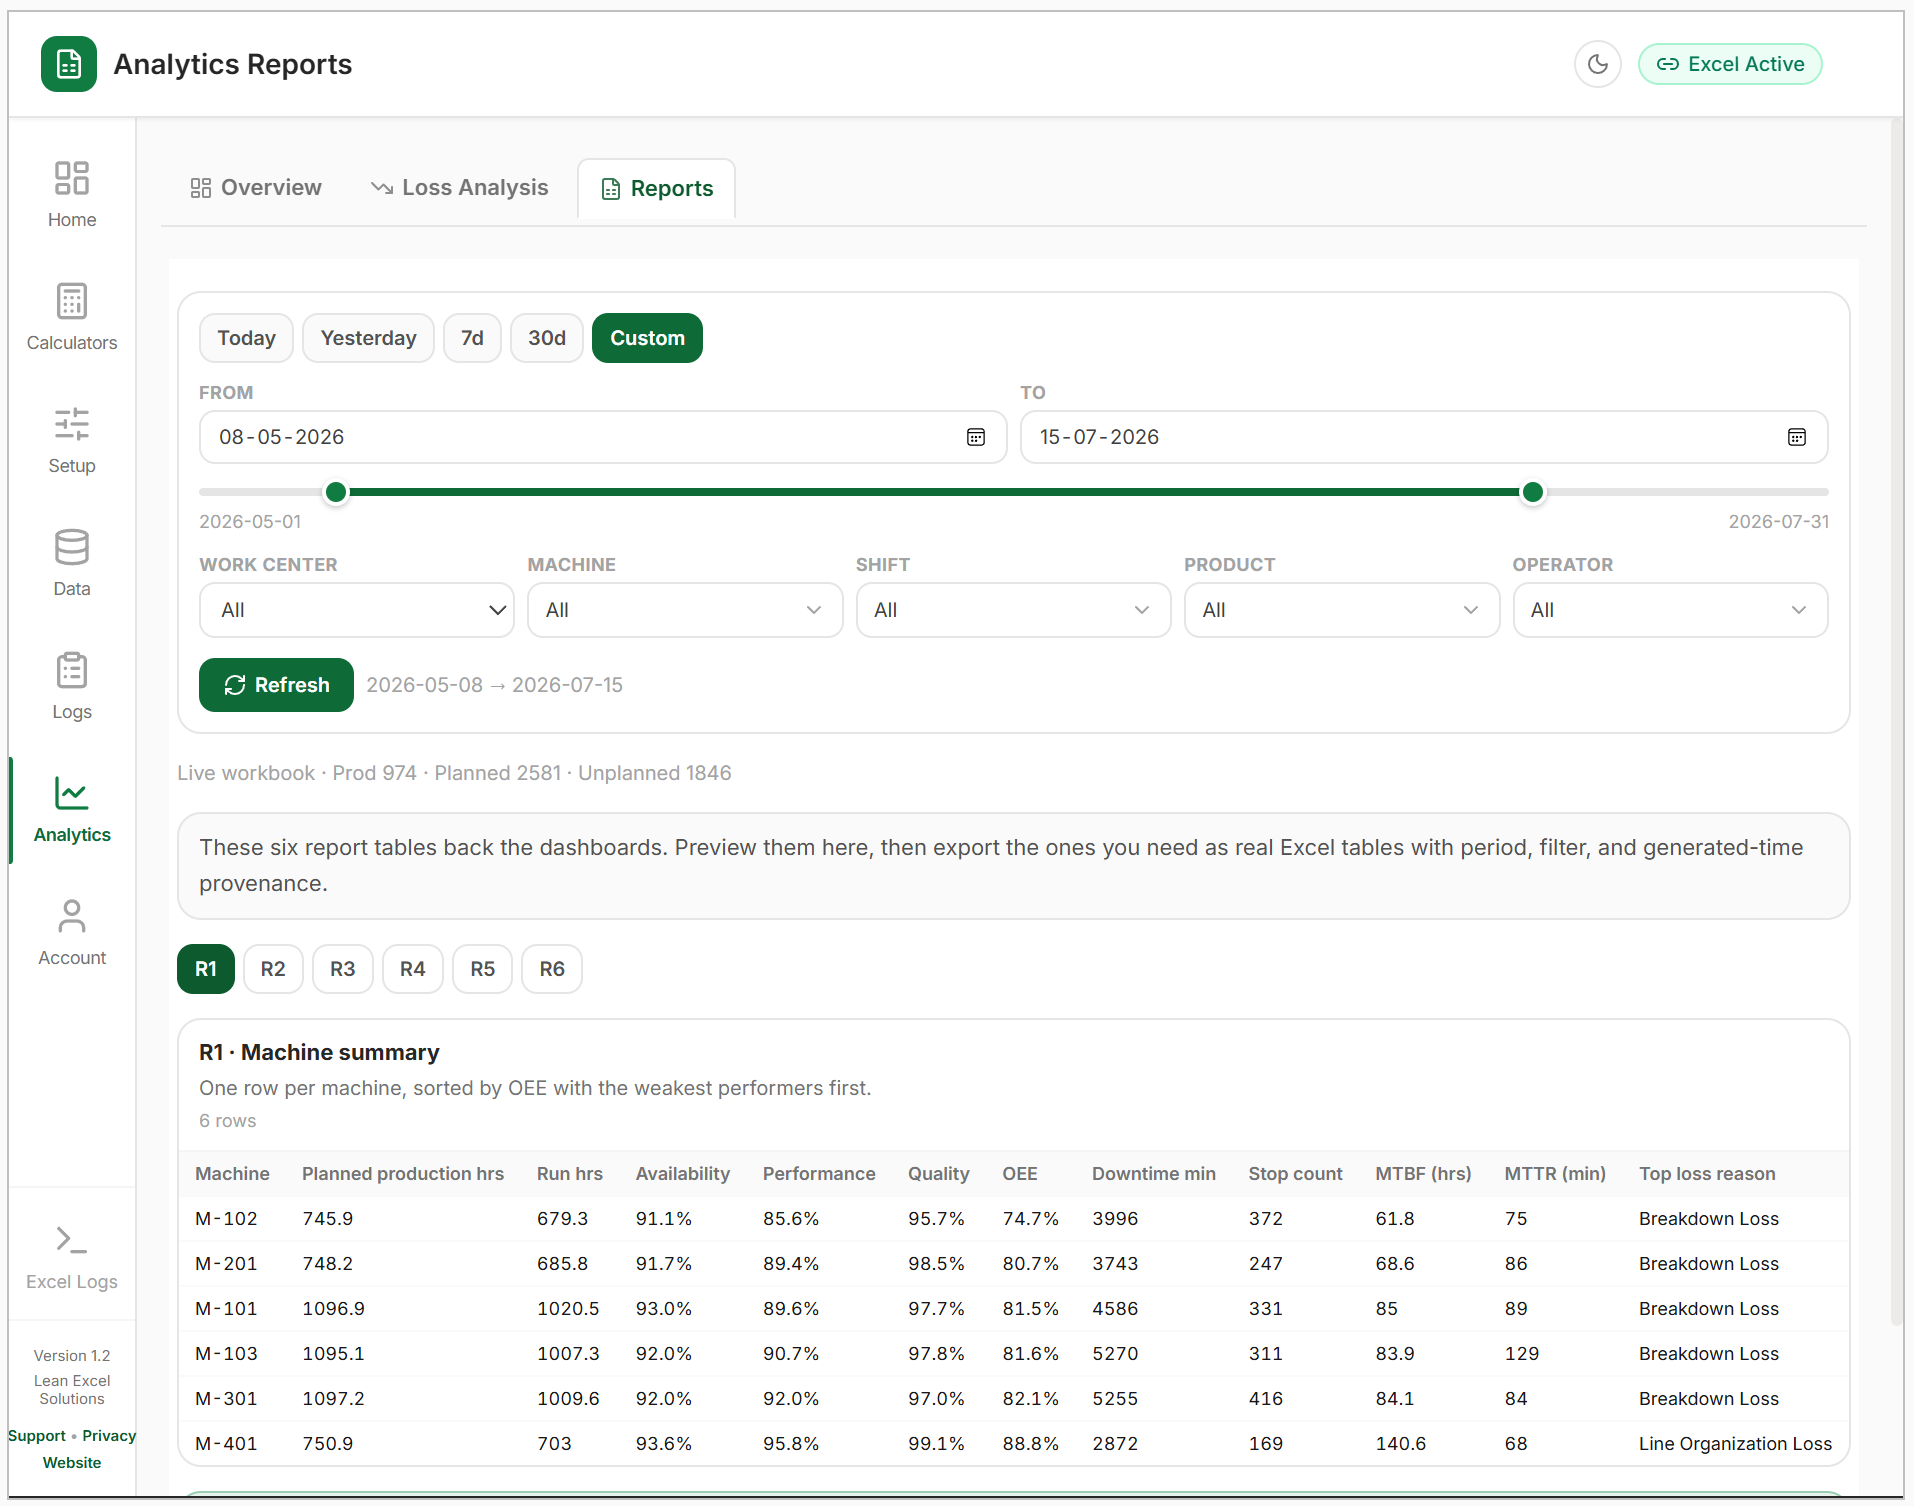
12-reports.png8. Troubleshoot
Confirm you are on a workbook (not a blank Excel start screen), then click again. The task pane needs the add-in host to load.
Reload the add-in. If you recently updated from AppSource, close Excel and reopen the file.
Account → sign in and confirm the subscription is active. Free OEE / Takt / Pareto should still work while locked.
Watch the Workbook progress line. A full demo is large on Desktop. When finished, Try Pro should show “Demo loaded.”
Someone renamed a required column, or Plant Profile changed. Recreate that table from Workbook (empty or demo).
Load the demo (or enough of your own logs), confirm Machines / Product Rates / Shifts / Loss Categories exist, tap Refresh, and pick a date range that covers the data.
Use Refresh in the helper. Edit the add-in table, not a renamed copy of the sheet.
Use Account → Manage billing for Paddle. Email hello@leanexcel.com and include the diagnostics line below.
9. Concepts
OEE
Overall Equipment Effectiveness = how much of planned time produced good parts at the ideal rate.
Run time ÷ net planned time. Unplanned downtime hurts this.
Actual output vs ideal cycle time during run time.
Good count ÷ total count. Rejects reduce OEE even when the line is running.
Wrong ideal cycle time, inflated planned time, or unlogged stops.
Takt Time
The beat the plant must hold to match customer demand.
Pareto
Sort losses or defects by impact. The tall bars on the left are usually where improvement work pays off first.
What’s new
Manifest 1.2.0.0 · Lean Operations Monitor- Product name — Lean Operations Monitor (same add-in; Lean Ops Pro is unchanged).
- Help Center — start-to-end operator path with screenshots. Click a picture to enlarge it.
- Analytics charts — clearer axes and empty states in the narrow Excel pane.
Contact
Email: hello@leanexcel.com
Website: www.leanexcel.com
Legal: Terms of Service · Privacy Policy
Lean Ops · add-in 1.2.0 · manifest 1.2.0.0
Paste diagnostics into your email so we can see version and host at a glance.